Evaluating the best residential time-of-use rate schedules in California for energy storage
by Adam Gerza on Sep 20, 2018
energy storage
project development
TOU rates
The residential energy storage market is continuing to ramp up on a hockey-stick shaped growth trajectory. According to Wood Mackenzie’s Q3 2018 U.S. Energy Storage Monitor report, the residential segment added 57.5 MWh of storage capacity nationwide last quarter, which is more than the 39.8 MWh installed all last year. The report also shows that California continues to be the leading state for storage deployments in the residential sector.
Homeowners are installing energy storage systems (ESS) in their homes for different reasons. Some are motivated to have back-up power in the event of a grid outage, while others want to become more energy independent and less reliant on their local utility company. In many cases, homeowners are at least partially motivated by the financial savings that ESS can deliver in the form of reduced electric bills. The primary storage savings opportunity in California today is time-of-use (TOU) arbitrage. TOU arbitrage utilizes an ESS to charge the battery when energy is cheap (off-peak), and then discharge back when energy is more expensive (on-peak). Just like arbitrage in the stock market, it basically means buying low and selling high.
How much savings homeowners can achieve by operating their ESS in TOU arbitrage mode is highly dependent on the TOU rate schedule. Some TOU rate schedules have a strong price signal, or wide TOU price differential, which makes for a more attractive savings opportunity. Others have a weak price signal, or skinny TOU price delta, which offers little if any, savings opportunity.
Comparing TOU rates
We wanted to see how the different TOU rates in California stack up against one another for ESS savings. In order to run this analysis, we needed to isolate the effect of the utility rate schedule on ‘savings from ESS’. For our methodology, we used the assumptions listed below, and kept every project input identical, except for the rate schedule. We utilized the Energy Toolbase storage simulation engine, operating in TOU arbitrage mode, to run two separate analyses: (1) ESS savings from a standalone ESS system, and (2) ESS savings for a solar+storage system.
Model inputs & assumptions:
- Usage: 1,000/kWh month, 12,000/kWh year
- Load profile: DOE/OPEN EI, typical residential load profile for a customer in Pasadena, California
- Rate tariff: most recent effective date
- NEM 2.0: $0.025/kWh non-bypassable charges (NBC’s)
- ESS system: Tesla Powerwall 2 (5 kW, 13.5 kWh, 100% depth of discharge, 90% round-trip efficiency)
- PV system: 5 kWdc, 15° tilt, 180° azimuth, PV Watts v5 API, Pasadena, California TMY station
- BMS: Time-of-use arbitrage mode (@ 100% TOU arbitrage efficiency)
- ESS only: no charge or discharge restrictions
- Solar+storage: ESS must charge from PV only
- Power ranking results
Power Ranking Results
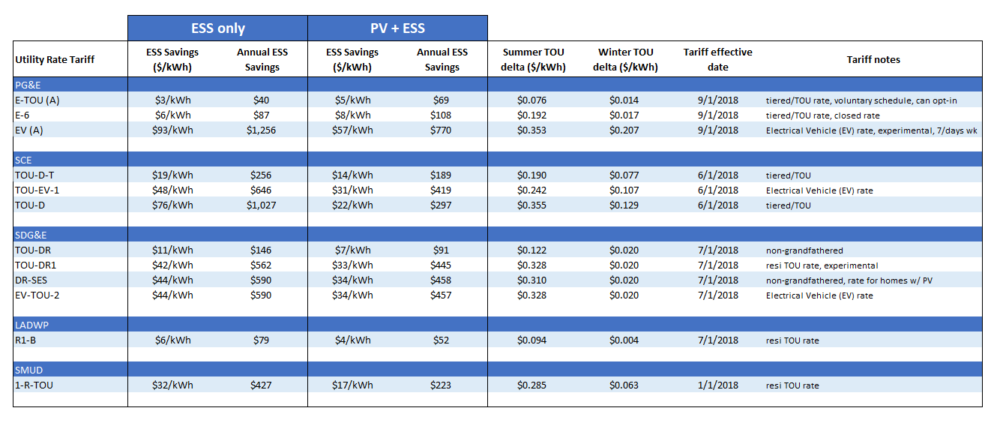
Disclaimers: These results are based on one case study load profile. Use caution when drawing generalized conclusions from this analysis. Savings from ESS are influenced by other factors besides the utility rate schedule, such as the shape of the homeowner’s energy usage profile, the size of the ESS, if they’re pairing ESS with PV, the size of the PV system relative to usage and restrictions on how the ESS is operated. We ran our simulations at 100% TOU arbitrage efficiency, which determines optimal savings. Storage developers are responsible to confirm the eligibility of all rate schedules for their customer.
Our results table clearly shows that the savings from ESS are heavily influenced by the TOU rate schedule. In both the ‘ESS only’ and ‘PV+ESS’ runs, the savings from ESS can vary widely from rate to rate. A wide TOU price differential is obviously directly correlated with a good rate for ESS savings, and vice-versa. To look at an extreme example of variance, a homeowner could capture over 30-times more savings on the PG&E (EV-A) rate, compared to the PG&E (E-TOU (A)) rate in the ‘ESS only’ run, and roughly 11-times more savings in the ‘PV+ESS’ run.
Unpacking the best & worst rate
The PG&E (EV (A)), which is an electric vehicle experimental rate, is the best rate schedule for storage savings in our analysis. The schedule has a wide TOU price differential year-round, with a whopping $35/cent per kWh price delta in the summer, and $21/cents/kWh in the winter. Furthermore, the TOU arbitrage price opportunity exists all seven days of the week, rather than only Monday through Friday, which is typical of most residential TOU schedules. When we ran our storage simulation, we dispatched the battery all 365 days of the year and captured the lucrative price differential, which led to the high $/kWh savings in both the ‘ESS only’ and ‘PV+ESS’ run.
The PG&E (E-TOU (A)) is a voluntary, opt-in TOU rate for PG&E homeowners. It’s the worst rate for ESS savings in our study. The TOU price differential in the winter is a meager $1.4/cents/kWh and $7.6/cents/kWh in the summer. To make matters worse, the winter season is defined as eight months-long (October through May), and the TOU price differential only exists on five days per week (Monday through Friday). Weekends are all “off-peak.” When you add it all up, this effectively means that for roughly 80% of the days in the year, no TOU arbitrage opportunity exists whatsoever. In the winter, at a TOU price delta of $1.4/cents/kWh it would be a losing proposition to cycle the battery at a 90% round-trip ESS efficiency. Hence the battery was dormant for four out of every five days when we ran our TOU arbitrage simulation, which led to the weak savings. This is a TOU-rino (TOU rate in name only), it has no teeth!