Since the Net Billing Tariff (NBT) went into effect on April 15th, 2023, many solar developers and customers in California have wondered what the program’s future and value of exported energy will look like. The 2024 update to the Avoided Cost Calculator (ACC) gives us a glimpse into what’s in store. In this blog, we’ll break down the ACC, the impact of this update, and how we’re handling it all in ETB Developer.
What is the ACC
The ACC is a tool used by California utilities and regulatory agencies to estimate the costs that utilities avoid by investing in distributed energy resources (DERs), like solar, battery storage, and demand response programs, rather than relying solely on traditional electricity sources. Developed and updated by the California Public Utilities Commission (CPUC), the ACC provides a standardized method to calculate the financial benefits of DERs. The avoided costs are calculated using several factors including wholesale energy costs, generation capacity, greenhouse gas emissions, and other factors.
The ACC is recalculated every two years to align with current market conditions, regulatory changes, and California’s ever-evolving clean energy policies. For instance, updates reflect changes in fuel prices, capacity needs, and environmental goals, ensuring that utility planning stays relevant to the state’s long-term objectives.
California investor-owned utilities (IOU) like Pacific Gas & Electric (PG&E), Southern California Edison, and San Diego Gas & Electric (SDG&E) use the ACC outputs to guide their rates and incentives for their DER programs like the NBT. The hourly export rates ($/kWh) that NBT customers receive for compensation are based on hourly ACC values averaged across days in a month, differentiated by weekdays and weekends.
The Different Tracks of Export Rates for NBT Customers
It’s important to note the two different tracks for export rates that NBT customers can be on: those with locked-in values or those with floating values. Customers who receive permission to operate (PTO) in a certain year will lock in export rates for the next nine years based on that current year’s version of the ACC. (The ability to lock in nine years of export rates only applies to customers that PTO within the first five years of the NBT program.) The year that a customer locks in their export rates is referred to as their “vintage year”. All other customers that either opt out of the locked-in values or PTO after the five-year cutoff will receive the floating export rates that change every year when the ACC is updated. The update to the ACC that goes into effect in January 2025 will provide a new set of nine-year export rates for customers to lock in for vintage years 2025 and 2026, and it will provide new floating export rates for customers that do not have locked–in rates.
What is the Impact of the 2024 ACC Update?
The impact varies for each of the IOUs, though their updates trend closely, and the overall effect should be assessed on a case-by-case basis. What is consistent across the IOUs is a stark reduction in the most lucrative export hours (>$1/kWh) in exchange for a larger window of elevated export hours as well as increases and decreases across the board. Consider the following heat map of PG&E’s weekday export rates for PTO 2024 to the new heat map for PTO 2025:
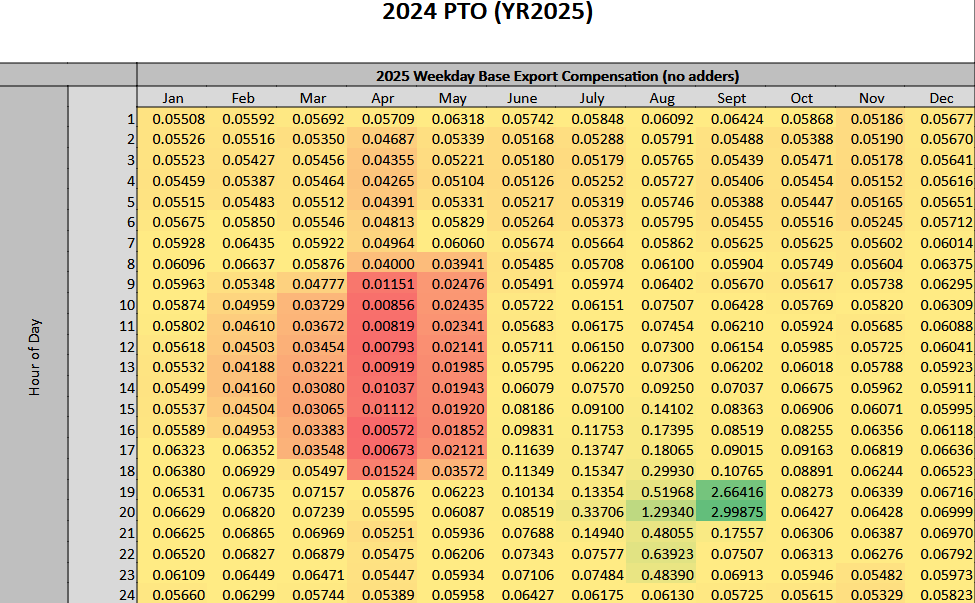
Figure 1: A heat map of export rates for PG&E‘s 2024 PTO year
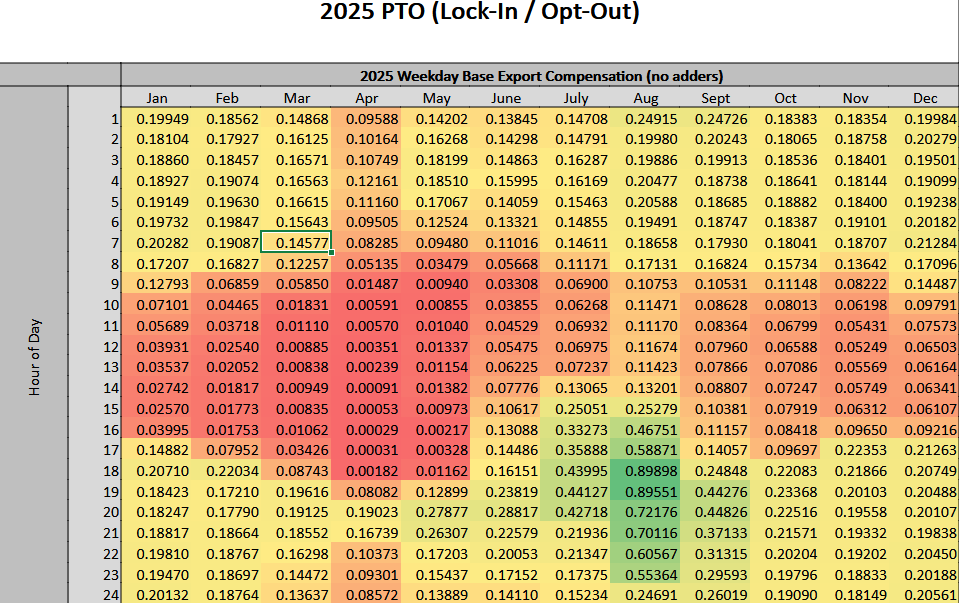
Figure 2: A heat map of export rates for PG&E’s 2025 PTO year
The first heat map has a small window of significantly higher export values while the second heat map shows reduced values spread across a larger period. For those who perhaps struggled to hit the small window consistently, this new larger window of values offers a better chance to do so, although at reduced value. Also, focusing on prime solar production hours like 9 a.m.- 3 or 4 p.m., we do see a slightly higher increase in export values on average for 2025 PTO, so there are higher values in some places, but this is tempered by reductions in other places as well.
Lastly, we do see a modest increase in some export rates outside of prime solar hours. These changes further reinforce the value of battery storage since that is the only way to capture the higher export rates outside of peak solar-producing hours. Our ETB Controller™ energy management system is unparalleled in its ability to target the most lucrative export hours to maximize savings and system performance, making it an invaluable tool for any solar and storage project.
How we use NEM Programs in ETB Developer to Handle NBT Export Rates
We recently implemented our NEM Programs feature for ETB Developer that includes pre-configured net metering or net billing programs that can be easily selected. A rate schedule that includes a year’s worth of export rates can be attached to a NEM Program, meaning we can create NEM Programs for all five of the possible vintage years for NBT customers, as well as a NEM Program for customers that receive the floating export rates that update annually.
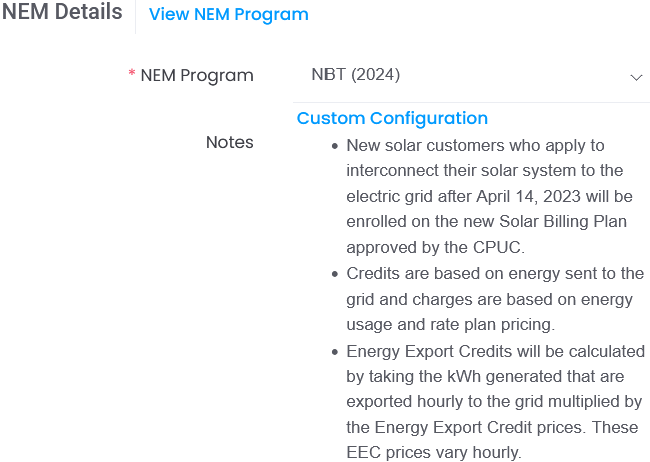
Figure 3: Example of a NEM Program for the Net Billing Tariff (NEM 3.0)
Moving forward, we will have NEM Programs available for every combination of ACC year + PTO year + lock-in and floating values.
We’re always looking for ways to give our users an edge. As the California solar and storage market continues to rapidly change, we’re doing our best to stay on top of it all and give our ETB users access to the most recent features and information. That is why we’re hosting a webinar to discuss the ACC update, NEM Programs, updates to the Self-Generation Incentive Program rules, and how to improve project financials by enrolling in Demand-Side Grid Support programs. Join us on December 12 for our ‘Navigating the 2025 California Solar + Energy Storage Market’ webinar as we cover all these topics and demonstrate how it all works in ETB! Register here for free.
Start modeling your projects and NEM Programs in ETB Developer free for 14-days by starting a free trial.
