


Table of Contents1. Overview ETB Energy Storage module 2. Value Streams BTM Storage Projects 3. ESS Simulation Type 4. ESS Hardware System Characteristics 5. ESS Software Control Settings 6. ETB Analytics module 7. ETB Optimizer feature 8. Integrations Energy Storage Service Providers 9. About us Energy Toolbase 10. Appendix key terms |
Overview ETB Energy Storage module
Energy Toolbase enables users to model, optimize, and propose the economics for any type of behind-the-meter (BTM) Energy Storage System (ESS). Our new storage module was designed to empower distributed energy developers to identify the best storage use-cases, efficiently focus their development resources, and close deals.
 | Validated Savings: run savings analysis that’s truly representative of how a vendor’s ESS would perform in the field. Objective, 3rd party modeling based on any vendor’s hardware & software specifications. |
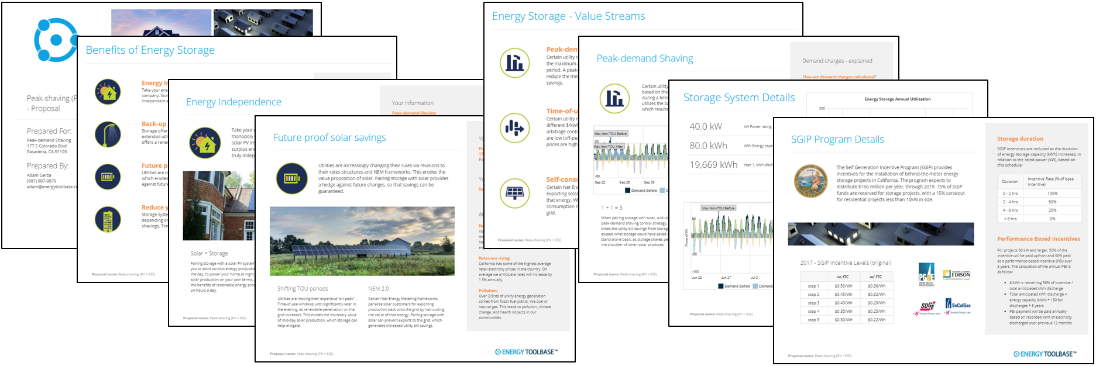
 | ESS Sales tools: choose from a library of storage proposal templates, communicate complex analysis in a clear and logical fashion. Optimize PV sizing, baseline load profiles, ESS incentives, CRM functionality and more. |
 | Powerful simulation engine: leverage ETB’s suite of control algorithms to simulate the performance and savings of an ESS project. Define all software control setting configurations and constraints. |
 | ESS Optimizer: goal seek the optimal system size for dollar savings, based on your customer’s load profile, utility rate schedule, NEM 2.0 assumptions, and solar PV profile. |
Value Streams BTM Storage Projects
Value streams are ‘avoided cost’ opportunities, or ways in which an ESS project can reduce a customer’s utility bill or generate revenue. Here’s a summary of Energy Toolbase’s primary BTM energy storage value streams:
 | Peak-demand shaving: some rate schedules have demand charges, which are billed based on the maximum power (measured in kW) used during a billing period. A ‘peak-demand shaving’ strategy utilizes the battery to reduce kW demand, which results in utility bill savings from lower demand charges. |
 | Time-of-use (TOU) arbitrage: some schedules have TOU pricing, where users pay different $/kWh rates based on when they consume. A ‘TOU arbitrage’ control strategy utilizes the battery to charge/buy when prices are low (off-peak), and discharge/sell when prices are high (on-peak), which results in utility bill savings. |
 | Self-consumption: some Net Metering frameworks penalize solar customers for exporting production to the grid by haircutting the value of that energy. When pairing storage with solar PV, a ‘self-consumption’ control strategy utilizes the battery to prevent exports to the grid, which results in increased savings. |
Other ‘value streams’:
- Back-up power: ESS to replace the cost of a back-up generator.
- Demand response: ESS to dispatch on critical-peak-pricing scheduled event days.
- Future-proof solar savings: ESS to hedge against future utility rate changes that erode solar PV savings.
- Rate schedule optimization: ESS to reduce the max annual (kW) demand under a certain threshold, to switch to a more favorable utility rate schedule.
- Grid services: in-front-of-the-meter, utility revenue-generating opportunities via ancillary services, such as frequency regulation, voltage support, reserve capacity, etc.
ESS Simulation Type
The ‘ESS Simulation’ type describes the method by which the ‘Energy Storage Performance’ profile gets generated. The ‘Energy Storage Performance’ profile is essentially a 365-day, 15-minute, charge and discharge profile of how the ESS System operates. In ‘Step 5 – Energy Storage’ when the user ‘Adds Energy Storage System’, they will choose which ‘ESS Simulation’ type to use.
ESS Simulation – methods:
- Energy Toolbase Simulation – user utilizes ETB’s internal simulation engine to generate the ‘Energy Storage Performance’ profile, based on their defined hardware (‘System Characteristics’) and software (‘Control Settings Info’) settings.
- Spreadsheet Interval Data – user imports a 365-day ‘Energy Storage Performance’ profile, which was generated outside ETB, and then defines the corresponding hardware (‘System Characteristics’) specifications of the project.
- ESS Service Provider Integration – user utilizes an ESS Service Provider Integration that they have been approved to use. User then selects from a pre-configured list of hardware, which generates the ‘Energy Storage Performance’ profile.
ESS Hardware System Characteristics
‘ESS System Characteristics’ describe the characteristics of the battery and inverter hardware. These values are generally listed on the manufacturer’s data sheet of a battery or inverter. Users can define the ‘ESS System Characteristics’ of the battery and inverter separately, or together as an integrated ESS System.
Users define the ESS System Characteristics in ‘Step 5 – Energy Storage’. There are two ways to define the ESS System Characteristics for a specific project:
Simple: users manually define the System Characteristics values, based on a generic ESS system.
Detailed: users select a from a list of ESS designs, where the System Characteristics values are pre-defined for a specific make and model.
Simple – System Characteristics:
A ‘simple’ system type, when defined in Step 5, assumes the battery has an integrated inverter. Here’s a brief description of each ‘System Characteristic’:
- Total Energy Capacity (kWh) – total amount of energy capacity (measured in kWh) storable in the battery.
- Max Discharge Power (kW) – maximum amount of instantaneous power (measured in kW) that can be discharged from the battery at a given point in time.
- Max Charge Power (kW) – maximum amount of instantaneous power (measured in kW) that can be charged into the battery at a given point in time.
- Max Depth of Discharge (%) – percentage of ‘Max Discharge Power’ that can be discharged from the battery (e.g. 80%).
- Discharge Efficiency (%) – the efficiency rate when discharging energy from the ESS system (e.g. 95%). For an integrated ESS system this includes discharge efficiency loses from both the battery and inverter.
- Charge Efficiency (%) – the efficiency rate when charging energy into the ESS system (e.g. 95%). For an integrated ESS system this includes charge efficiency loses from both the battery and inverter.
- Battery Degradation Rate (%) – represents the annual degradation rate of the battery (e.g. 5%). The battery degradation rate applies to total energy capacity (kWh).
Note: users can configure the default simple ‘ESS System Characteristics’ that pre-populate via ‘Company Settings’ > ‘Energy Storage Settings’ > ‘Additional Energy Storage Variables’.
Detailed – System Characteristics:
Selecting the ‘Detailed’ option, users will choose from a drop-down list of specific make and model equipment, where the System Characteristics have been pre-configured. There are 2 ways to add ‘Detailed’ equipment into the drop-down menu.
- User manually adds custom equipment via their ‘Company Settings’
- ETB auto-generated all previously used ESS equipment combinations a user previously used on our legacy storage module (before September of 2017)
Adding new equipment:
‘Company Settings’ > ‘Energy Storage Settings’ tab > ‘Batteries’ or ‘Inverters’ tab
Design Type:
- External Inverter – user specifies battery characteristics & inverter characteristics separately
- Integrated Inverter – user specifies integrated battery + inverter characteristics once
Pre-configured equipment (migrated from Legacy storage site):
Energy Toolbase has pre-configured any equipment combinations that a user Account previously used on our Legacy ESS storage release (pre-September 2017). These ‘Detailed ESS Designs’ can be edited or deactivated via ‘Company Settings’ > ‘Energy Storage Settings’.
ESS Software Control Settings
The ‘ESS Control Settings’ are the programmable rules and instructions that dictate how the software battery management system (BMS) operates. For example, a user may configure the ‘ESS Control Settings’ to require that: ‘ESS must charge from Solar PV Generation Only’ AND ‘ESS cannot export to the grid’ for a specific project. Based on the user’s defined ‘ESS Control Settings’, the BMS will then generate a 365-day ‘Energy Storage Performance’ profile for that project or simulation.
Defining ‘ESS Control Settings’:
Under the ‘Control Settings Info’ section the user can specify which control strategies to utilize, as well as their ‘Charging Restrictions’.
Clicking on the ‘Show Additional Details’ hyperlink brings up the full ‘ESS Control Settings’ menu where can specify all their simulation settings and efficiency rates.
General Info – ‘Charging Requirements’:
- Charge from Solar PV Generation Only – sets a requirement that the battery can only charge from PV generation.
- No Charging Restrictions – no battery charging requirement (i.e. battery can charge from the grid or PV generation).
Peak Demand Shaving:
|  |
Time of Use Periods:
- Target TOU Demand Periods – in addition to ‘Max/NC demand’ charges, the ‘peak demand shaving’ algorithm will also consider any ‘TOU demand’ charges, when determining the ‘energy storage performance’ charge/discharge profile of the system.
- Do Not Target TOU Demand Periods – the ‘peak demand shaving’ algorithm will only consider ‘Max/NC demand’, when determining the ‘energy storage performance’ of the system. In other words, the utility rate schedule defined in ‘Step 2’ is irrelevant.
Peak Shaving Efficiency:
The percentage of savings captured from ‘peak demand shaving’, relative to the highest savings possible.
i.e. @ 100% peak shaving efficiency the BMS charges/discharges at perfect efficiency to capture 100% of the total possible dollar savings opportunity from ‘peak demand shaving’. The project realizes 100% of the mathematical optimum savings.
i.e. @ 75% peak shaving efficiency the BMS charges/discharges at 75% efficiency to capture 75% of the total possible dollar savings from ‘peak demand shaving’. For example, if optimal annual savings from ‘peak demand shaving’ is $10,000, then at 75% peak shaving efficiency rating, the realized annual savings would be $7,500.
Peak Shaving Utilization Rate:
The percentage of energy cycling (measured in kWh energy discharged) from ‘peak demand shaving’, relative to the minimum amount of energy cycling required. The utilization rate can be thought of as the amount of ESS energy throughput or effort expended.
i.e. @ 0% peak shaving utilization rate the BMS cycles the minimum amount of energy required, measured in ‘annual energy discharge (kWh)’, for ‘peak demand shaving’. The BMS expends the mathematical minimum amount of effort possible.
i.e. @ 100% peak shaving utilization rate the BMS cycles the maximum amount of energy possible, measured in ‘annual energy discharge (kWh)’, for ‘peak demand shaving’. The BMS expends the mathematical maximum amount of effort possible.
Energy Arbitrage:
 |  |
Treatment for Exported Energy:
- Prevent all exported Energy to Grid – prevents any energy (PV or ESS) exports to the grid.
- Allow Solar PV Exports Only – prevents ESS exports to the grid, does not restrict PV exports.
- Allow Solar PV or ESS Exports – no restrictions on either PV or ESS energy exporting to the grid.
Energy Arbitrage Efficiency:
The percentage of savings captured from ‘energy arbitrage’, relative to the highest savings possible.
i.e. @ 100% energy arbitrage efficiency the BMS charges/discharges at perfect efficiency to capture 100% of the total possible dollar savings opportunity from ‘energy arbitrage’. The project realizes 100% of the mathematical optimum savings.
i.e. @ 75% energy arbitrage efficiency the BMS charges/discharges at 75% efficiency to capture 75% of the total possible dollar savings opportunity from ‘energy arbitrage’. For example, if the optimal annual savings from ‘energy arbitrage’ is $10,000, then at 75% energy arbitrage efficiency, the realized annual savings would be $7,500.
Self-consumption:
 |  |
Self-consumption only applies when pairing ESS with solar PV, whereby the control strategy will seek to prevent PV exports to the grid, because there is a price signal to do so. Energy Toolbase treats ‘Self-consumption’ as a form energy arbitrage. In ‘TOU arbitrage’ the price signal (or opportunity for savings) is the $/kWh difference between the on-peak and off-peak rate. Whereas in ‘self-consumption’, the price signal (or opportunity for savings) is the $/kWh difference between the retail rate and export rate.
Treatment for Exported Energy:
- Prevent all exported Energy to Grid – prevents any energy (PV or ESS) exports to the grid. Note: this option instructs ETB’s algorithm to prioritize ‘self-consumption’ over ‘TOU energy arbitrage’.
- Allow Solar PV Exports Only – prevents ESS exports to the grid only, does not restrict PV exports. Note: this option instructs ETB’s algorithm to prioritize whatever value stream offers the best price signal, between ‘self-consumption’ and ‘TOU energy arbitrage’.
- Allow Solar PV or ESS Exports – no restrictions on either PV or ESS energy-exporting to the grid. Note: this option turns off ‘self-consumption’ control strategy.
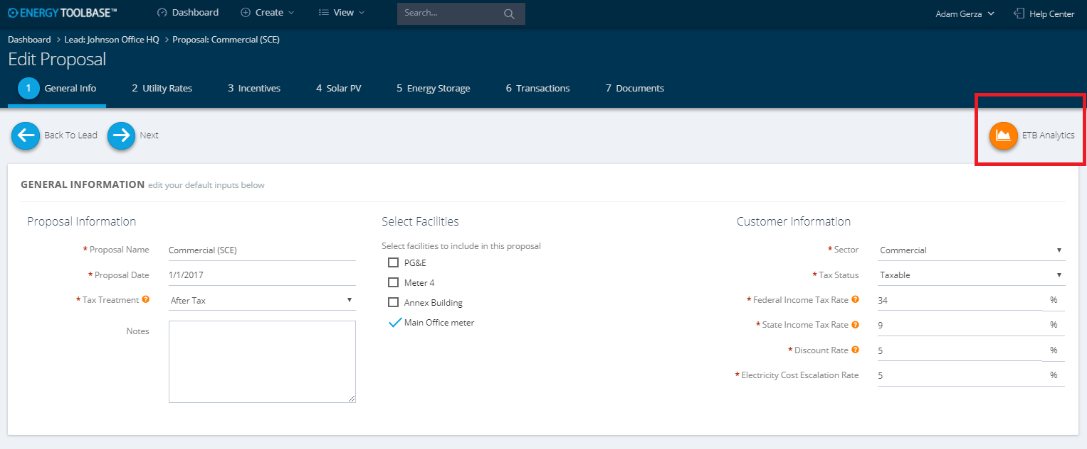
ETB Analytics Module

The ‘ETB Analytics’ module enables users to reference or download different types of proposal data. ‘ETB Analytics’ is a great tool for viewing summary data of the ‘Energy Storage System Performance’. The ‘ETB Analytics’ tool can be accessed from any step within the ‘Edit Proposal’ screen.
Tabs within ‘ETB Analytics’ module:
- Monthly Electricity Costs: 12-month summary table of usage, solar production, energy storage performance, energy imports/exports and costs.
- Demand Profile Visualization: an interactive charting environment that enables users to visualize consumption, solar production, energy storage performance, and costing data.
- Download Proposal Data: enables users to download a complete summary of ‘Proposal Data’ or specific types of ‘Interval Data’ for a given proposal.
Monthly Electricity Costs – tab:
The ‘Monthly Electricity Costs’ tab displays a 12-month summary table of electricity costs, identical to the table displayed in a proposal Document. The interactive table enables users to toggle different types of displays and values into the table.
Sections within ‘Monthly ‘Electricity Costs’:
- Utility Rate Options: user defines which utility rate schedule to display, as defined in ‘Step 2 – Utility Rates’.
- Charges and Usage Options: user defines usage & charges, either before the project (‘Current’) or after the project (‘New’).
- Display Options: user selects to display: ‘Solar PV Generation’, ‘Energy Import/Export’, ‘Time of Use Details’, ‘Detailed Charges’ and ‘Non-bypassable Charges’ (if applicable).
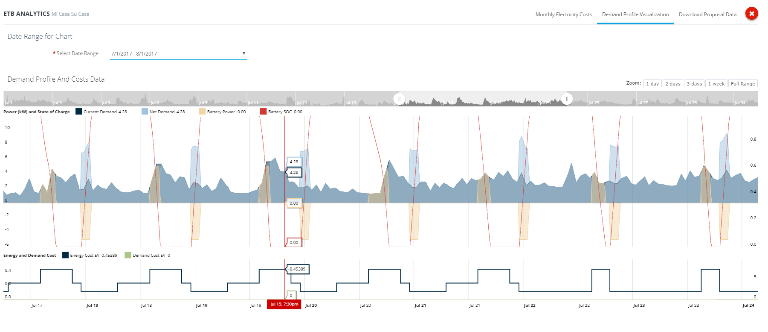
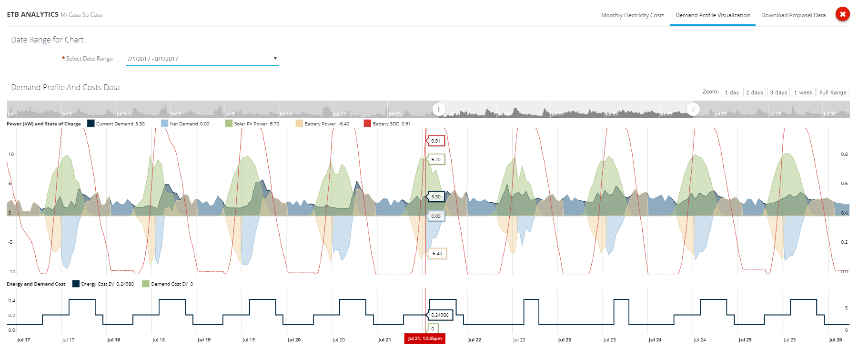
Demand Profile Visualization – tab:
The ‘Demand Profile Visualization’ module is an interactive charting environment that allows users to visualize their customer’s interval data, including: consumption data, solar PV production data, EES charge/discharge data, and net usage data.
Mouse gestures on the chart:
- Hovering the mouse on the chart displays selected data types at given time intervals.
- Click, hold & drag on the chart creates a highlight, to zoom in to a tighter time horizon. Users can also choose a zoom range on the top-right of the chart.
- Toggle legend values On or Off to display or not display a data type on the chart.
Energy and Demand cost:
On the bottom of the chart in the ‘Energy and Demand Cost’ section, users can visually display Energy Costs ($/kwh) and Demand Costs ($/kw) for the selected utility rate schedules as defined in ‘Step 2 – Utility Rates’.
Download Proposal Data – tab:
The ‘Download Proposal Data’ tab enables users to download different types of data into an Excel (.csv) formatted file.
Download Data Types:
- Proposal Data Download: downloads an Excel (.csv) formatted file containing a summary of all the project inputs and calculated values for a given proposal.
- Interval Data Download: downloads a 365-day, 15-minute interval data file in a multi-column formatted, Excel (.csv) file. For each facility in a proposal, users can select to download ‘Current Usage’, ‘Solar PV Generation’, ‘Energy Storage Performance’, or ‘Net Usage’ data.
ETB Optimizer Feature

The ‘ETB Optimizer’ simulates the avoided cost of 10 different ESS system sizes, based on the user’s specified proposal inputs, and then visualizes the results into interactive charts. The ‘ETB Optimizer’ is a powerful tool for determining the optimal ESS system size, based on different hardware (‘ESS System Characteristics’) and software (‘Control Strategy Specifications’) configurations
The ‘ETB Optimizer’ is accessed via the Energy Storage System Details page in ‘Step 5 – Energy Storage’. The user can choose to define the minimum and maximum ESS – kW DC power rating. By default, the Minimum is set at 5% of the max annual demand, and the Maximum set at 100% of the max annual demand of the Energy Use Profile.
Variables the ‘ETB Optimizer’ references:
The ‘ETB Optimizer’ references several different variables, when performing its simulation, including:
- Energy Use Profile: usage data, either gross or net of solar PV production.
- Utility Rate Schedule: both the ‘Current’ and ‘New’ rate schedule, as well as all ‘additional metering details’ as defined in ‘Step 2 – Utility Rates’.
- ESS System Characteristics: either ‘simple’ or ‘detailed’ ESS System Characteristics, including kWh Energy Capacity, kW Max Power, Max Charge Power, Max Depth of Discharge, Discharge Efficiency, Charge Efficiency, Battery Degradation Rate, as defined in ‘Step 5 – Energy Storage’.
- ESS Control Settings: all ESS Control Settings Info, including charging requirements, peak-demand shaving efficiency, and utilization rate, energy arbitrage efficiency, treatment for exported energy, as defined in ‘Step 5 – Energy Storage’.
ETB Optimizer – Display Charts:
The ETB Optimizer simulates 10 different sized ESS systems, which are proportionally spaced, displayed on the x-axis of each chart in: DC Power Rating (kW) / Capacity Rating (kWh) – units. The PV optimizer outputs (6) separate interactive charts. Users can toggle the ‘Maximum Full Discharge Duration’ by moving the slidebar, which re-optimizes the ESS system size, based on a different ESS system rating (kW / kWh) ratio.
- Blended Electric Bill Savings: displays the blended ESS savings, expressed in $/kWh.
- Energy Savings: displays the energy savings, or $/kWh portion of bill savings only.
- Demand Savings: displays the demand savings, or $/kW portion of bill savings only.
- Total Electric Bill Savings: displays the total utility bill savings, which is the ‘energy savings’ + ‘demand savings’.
- Annual Peak Demand with ESS: displays the post ESS, Max Annual Peak Demand, measured in kW.
- Annual Exported Energy: displays the amount of annual energy exports to the grid (kWh), and the percentage exported to the grid = (kWh exports / total kWh production).
Reading/interpreting Rate Switching scenarios:
- No rate switching: if the user does not define a rate switch in ‘Step 2 – Utility Rates’ > then only one line will be displayed on the chart.
- Rate switching: if the user defines a rate switch in ‘Step 2 – Utility Rates’ > then (4) separate lines will be displayed on each chart.
Mouse gestures on the chart:
- Hovering the mouse over any point on the chart to see the exact value for a given system rating (kW/kWh).
- Click, hold, drag & release on the chart to zoom in on a tighter range, which will re-simulate the Min & Max ‘system rating’ range on all the charts.
- Click once on any point on the chart to populate that specific ‘system rating’ into the ‘System Characteristics’ field above.
Integrations Energy Storage Service Providers
Energy Storage – Service Provider Integrations enable ETB users to run instantaneous, validated savings analysis, for a specific energy storage vendor’s ESS system. Energy Storage Service Providers pre-configure their hardware (‘ESS System Characteristics’) and software (‘Control Strategy Specifications’) settings in Energy Toolbase, to reflect how their ESS systems would operate in the field.
Apply for access to an ESS integration:
Accessing an Energy Storage Service Provider’s integration requires approval from the energy storage service provider. Users can apply for access in either ‘Company Settings’ or in ‘Step 5’.
- From ETB Dashboard screen > select ‘Company Settings’ from drop-down menu.
2. Select ‘3rd Party Services’ tab. Energy Storage Service Providers are listed on top. Click on the logo of any greyed out ESS provider to apply for access to that service
3. View the Energy Storage Service Providers terms & conditions > click ‘I Accept’ to apply for access to the integration service.
Disclaimer: An Energy Storage Service Provider may also require an Energy Toolbase Account/User to download and sign a separate ‘Dealer Agreement’, before providing access to their integration service. The terms & conditions of the ‘Dealer Agreement’ are between the Energy Storage Service Provider and the Energy Toolbase User Account. Energy Toolbase is not a party to the ‘Dealer Agreement’.
4. After completing the registration application by accepting the terms and signing any ‘Dealer Agreement’ the status will change to ‘Application Pending’:
a. If approved: the status will change to ‘Application Approved’.
b. If rejected: the status will change to ‘Application Rejected’.
Benefits of Integration for Energy Storage Vendors
| Validated Savings. Globally define hardware (ESS System Characteristics) & software (ESS Control Settings) in Energy Toolbase, enabling dealers to run simulations and ‘avoided cost’ analysis that is representative of how their ESS would perform in the field. Give approved dealers assurance the savings estimates they present to customers are validated. |
| Zero software engineering. Leverages ETB’s suite of software control algorithms to specify: efficiency ratings, utilization rates, setpoints and constraints to reflect how specific ESS systems operate in the field. Launch, test and iterate different ESS hardware and software configurations without expending any software development resources. |
 | Empower dealer network. Enable dealers to instantaneously analyze, optimize and propose the economics of specific ESS configurations. Empower dealers to identify the highest value projects and allocate their development resources efficiently. |
| Administrative controls. Storage vendors maintain full discretion to approve or rescind access to dealers accessing their service via an admin dashboard. Vendor has full visibility to see the sales pipeline of their approved dealers, viewing key project details of projects quoted utilizing their integration service. |
 | Outsource support & rate analysis. ETB specializes in the complexities of ‘utility rate’ and ‘avoided cost’ analysis. From constantly changing utility tariffs and billing methodologies, to rate switching scenarios, to NEM 2.0 frameworks. Outsource this critical and time-consuming function to our team of trained Integration Specialists, who provide private training and support to your valued dealer network. |
 | Access to downstream channel. ETB promotes the storage vendor integration service to our industry leading user-base of over 1,000 DER organizations nationwide. ETB features storage vendors on our front-end website and on ‘Step 5 – Energy Storage’ within our ‘Edit Proposal’ screen, which drives brand awareness. |
About Us
Energy Toolbase is an industry-leading software platform that specializes in modeling and proposing the economics of solar and energy storage projects. Over 1,000 distributed energy organizations nationwide use our SaaS platform to accurately, objectively, and transparently analyze their projects. Clients include leading residential and commercial installers, project developers, EPCs, ESCO’s, financiers, policy organizations, and utility companies.
“Energy Toolbase empowers distributed energy professionals in both the residential and commercial market segment to identify the best storage use-cases, efficiently focus their development resources, and close deals.”
– – John Gurski, Founder & CEO
ESS product features:
- In-house utility rate database – spans 400+ utility territories in all 50 states, enabling objective and transparent: ‘utility rate’ and ‘avoided cost’ analysis.
- Data import – best-in-class importation of billing or interval meter data from any file format.
- Baseline interval data – our ‘ETB Load Profiler’ feature enables users to synthetically create a 365-day load profile, based on a representative profile, when interval data is not available.
- System size optimization – determine the optimal sized energy storage system for dollar savings, based on the specifics of the customer and project.
- Goal seek – determine an ESS system size for a specific outcome (i.e. preventing exports to the grid, or reducing annual Max/NC demand to a specific threshold).
- Professional proposals – create brilliant, customized, dynamic proposal templates. Present complex storage analysis in a clear and logical fashion.
- NEM 2.0 – precisely model any scenario where exports to the grid are valued at less than the retail rate. Determine exported energy and the effect on project economics.
- Personalized support – dedicated Integration Consultants are assigned to each account, offering private support, onboarding and training.
Appendix key terms
Battery Degradation Rate (%): represents the annual degradation rate of the battery (e.g. 5%). The battery degradation rate applies to total energy capacity (measured in kWh).
Battery Management System (BMS): software operating system of the battery that is programmed to target value stream(s) and dictates when the storage system charges and discharges.
Charge Efficiency (%): the efficiency rate when charging energy into the ESS system (e.g. 95%). For an integrated ESS system, this includes charge efficiency loses from both the battery and inverter.
Discharge Efficiency (%): the efficiency rate when discharging energy from the ESS system (e.g. 95%). For an integrated ESS system, this includes discharge efficiency loses from both the battery and inverter.
Energy Arbitrage Efficiency: the percentage of savings captured from ‘energy arbitrage’, relative to the highest savings possible.
Energy Storage Performance profile: a 365-day, 15-minute charge/discharge profile of how the ESS System operates throughout the year, which is specific to a given project or simulation.
Max Discharge Power (kW): maximum amount of instantaneous power (measured in kW) that can be discharged from the battery at a given point in time.
Max Charge Power (kW): maximum amount of instantaneous power (measured in kW) that can be charged into the battery at a given point in time.
Max Depth of Discharge (%): percentage of ‘Max Discharge Power’ that can be discharged from the battery (e.g. 80%).
Perfect Math: mathematical maximum amount of dollar savings possible, based on the users defined project assumptions (i.e. storage system characteristics, software controls restrictions, etc.)
Peak-demand shaving: a control strategy that utilizes the battery to reduce kW demand, which results in utility bill savings from lower demand charges.
Peak Shaving Efficiency: the percentage of savings captured from ‘peak demand shaving’, relative to the highest savings possible.
Peak Shaving Utilization Rate: the percentage of energy cycling (measured in kWh energy discharged) from ‘peak demand shaving’, relative to the minimum amount of energy cycling required. The utilization rate can be thought of as the amount of ESS energy throughput or effort expended.
Time-of-use (TOU) arbitrage: a control strategy that utilizes the battery to charge/buy when prices are low (off-peak), and discharge/sell when prices are high (on-peak), which results in utility bill savings.
Total Energy Capacity (kWh): total amount of energy capacity (measured in kWh) storable in the battery.