There are some common misconceptions when it comes to demand charges. Most electric utility customers can easily understand the concept of being charged for electricity based on the amount of energy used. But misunderstandings arise for some business owners when lowering their energy usage does not proportionally correspond to a lower electric bill. Can a business owner lower their costs by simply consuming less electricity? If the rate tariff that electric customer is billed under includes demand charges, perhaps not.
Energy vs. Demand
Electric utility bills are generally comprised of three main charge types:
- Fixed charges – non-volumetric charges, which are typically unavoidable and assessed for being connected to the grid.
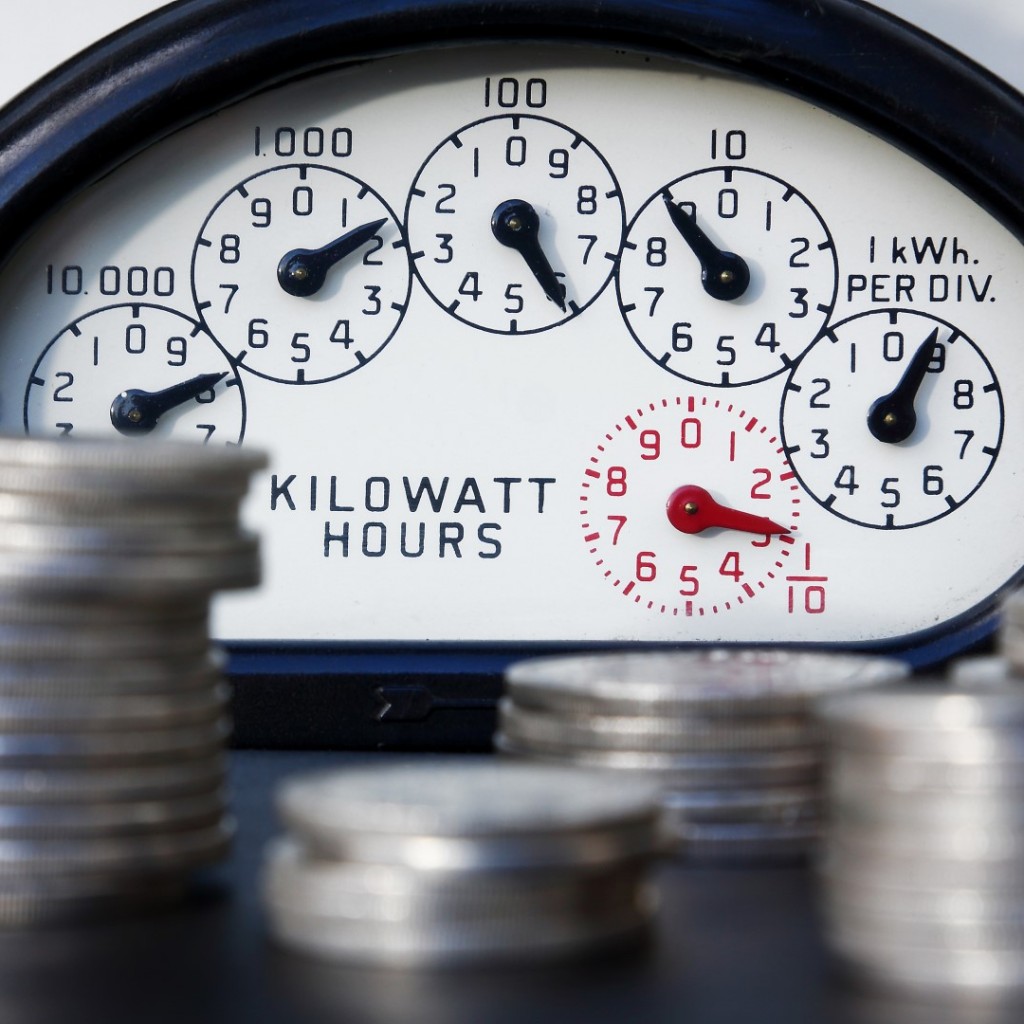
- Energy charges – dollar per kilowatt-hours (kWh) charges, which are volumetrically billed based on the amount of electricity consumed over a period of time.
- Demand charges – dollar per kilowatts (kW) charges, which are billed based on the maximum amount of power (kW) consumed during a single point in time.
To further illustrate the difference between energy and demand charges, let’s discuss how an appliance would be billed for both kWh energy and kW demand. A central air conditioner has an average wattage rating of around 3,500 watts. To determine how much kWh energy would be consumed to run the A/C for eight hours, the energy = power x time equation would be used:
(3500 watts x 8 hours)/1000 = 28 kWh
When calculating demand, it is not the amount of energy consumed, but rather the power or rate at which energy is consumed. Demand is measured in kilowatts, the more quickly energy is used, the higher the demand value will be. Looking at the A/C example above, let’s assume that a water heater with a rating of 4,000 watts is also being used during one of the eight hours. When both appliances are used simultaneously, 7.5 kW of power is demanded. Instead, if the water heater ran prior to the A/C kicking on, the demand over the eight-hour span would not exceed 3.5 kW. While the total amount of energy consumed would be the same in either scenario, the demand readings would differ.
Basic Demand Calculation
kWh ÷ Hours = kW
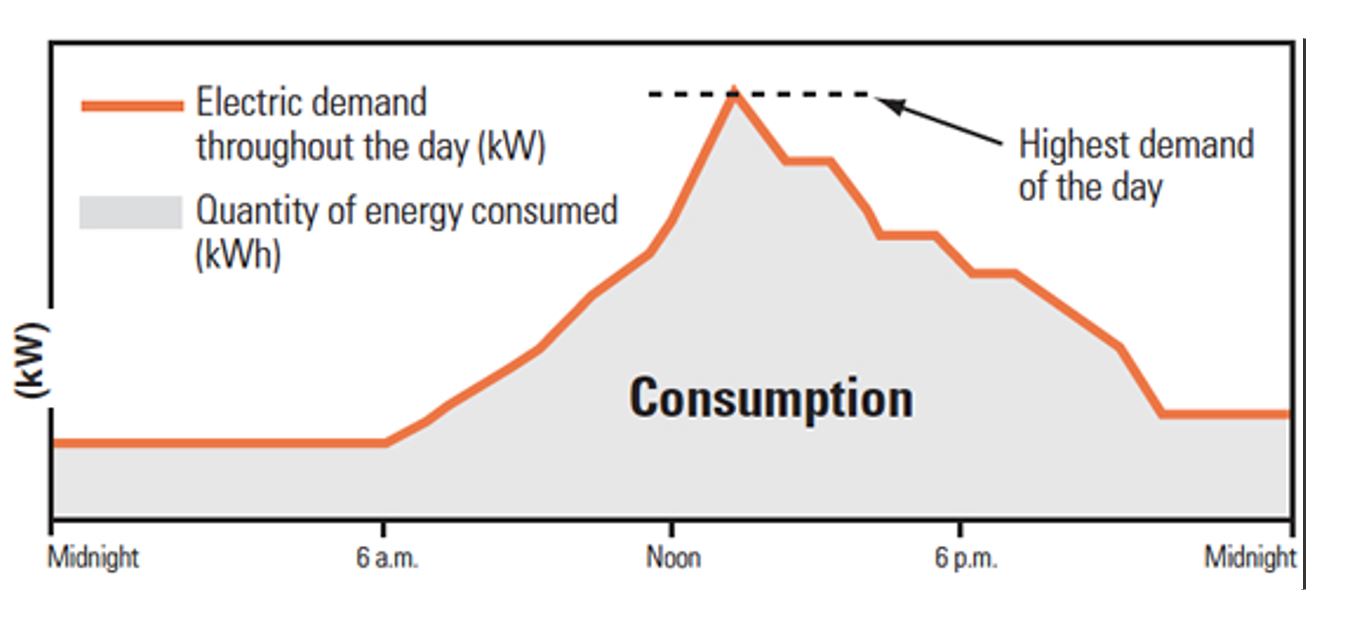
Image Source: We Energies
The highest kW amount of power used when calculating demand charges is often referred to as a customer’s max or non-coincident demand. It’s effectively the highest average electricity usage measured over a specified time interval, such as 15 minutes. The image below illustrates where the peak demand for a single day would be derived from in relation to the energy consumed.
Why Utilities Levy Demand Charges
Maintaining sufficient power capacity to serve all electric customers at any moment is expensive and requires an over-building of generation resources for utilities. Demand charges allow utilities to equitably recover the costs associated with supplying and maintaining enough generation capacity. Electric customers with the greatest power requirements pay for their share of capacity. It’s not uncommon for large commercial and industrial (C&I) customers to have demand charges comprise over 50% of their total electric bill. Similar to energy charges, demand charges effectively incentivize customers to alter their consumption behaviors. However, demand charges can be nuanced, which requires customers to have an understanding of the different types of demand charges.
Types of Demand Charges
- Max/Non-coincidental – charged based on a customer’s highest kW demand within a billing period, irrespective of when the utility’s peak is set.
- Time-of-Use – charged based on the customer’s highest kW demand within a specific time period. TOU demand charges are generally aligned to be coincident with the utility’s system-wide peak. For example, the “on-peak” TOU demand period in California is 4 pm – 9 pm.
- Flat – $/kW demand charges that are assessed based on a single kW demand reading.
- Tiered – $/kW demand charge that differs depending on whether a customer is above or below a specified demand threshold.
- Daily – $/kW/day demand charges that are measured and billed each day within a billing period.
Demand charges are typically assessed to commercial or industrial (C&I) customers, who contribute the largest power capacity needs on the grid. Although currently viewed as uncommon, an increasing number of utilities are incorporating demand charges on residential rate tariffs as well. For example, Arizona Public Service (APS) has levied demand charges on residential customers for several years now. Also, Duke Energy’s standard Residential Time-of-Use rate (RT), offered in both North and South Carolina, assesses On-Peak demand charges year-round.
Daily demand charges, which bill on a $/kW/day basis are a newer occurrence that is expected to become more prevalent. In November 2019, Pacific Gas and Electric (PG&E), one of the major investor-owned utilities (IOUs) in California, released their “Option S” rate, which incorporates daily demand charges. The rates were driven in part to offer a more equitable and advantageous price signal to customers deploying energy storage. This Option S rate has limited capacity and is only available to customers who install an energy storage system (ESS).
Ratchets
Many demand charges have an associated ratchet that applies when determining the demand figure that will be used in billing. A demand ratchet can be viewed as a minimum level billed; a customer’s actual observed demand reading could be significantly lower than what they are billed for. Some demand ratchets can be quite complex, involving different equations and conditional calculations. The two most common ratchet types seen are 1) a fixed kW minimum and 2) a minimum derived from applying a percentage to a reference variable.
An example of a complex demand ratchet can be found on the “Orange and Rockland Utilities – New York” SC 3 rate, which includes both demand ratchet types.
“Determination of Demand:
The billing demand shall be defined as the highest 15-minute integrated kW demand determined during the month by the use of a suitable demand indicator. The minimum billing demand shall be 100 kW.
The billing demand for the billing months of October through May inclusive shall not be less than 70% of the highest metered demand for the preceding billing months of June through September inclusive.”
The tariff excerpt above states that customers under this rate will never be billed less than 100 kW. In addition, during the winter months, the billing demand will not be less than 70% of the highest demand occurred during the summer months. For example, if a customer’s max demand during the month of November is 150 kW but their demand in August was 400 kW, their November bill will include 280 kW (400 kW x 0.70) as the billing demand.
The utility rates team at Energy Toolbase is continually coming across new demand ratchet structures. It seems utilities are constantly getting more creative in designing new structures. The demand ratchet-type mentioned above can now seamlessly be modeled on ETB Developer. The most recent v4 update of our ETB Developer introduced new ratchet functionality and further streamlined the process of modeling more complex demand charge types and ratchets.
The Evolution of Demand Charges
Our utility rates team tracks different demand charge structures throughout the globe and has seen a number of changes over the years. One general trend that will come as no surprise to anyone is that similar to $/kWh energy charges, $/kW demand charges are generally continuing to escalate. How demand charge increases are implemented varies widely. For example, in California utilities have lobbied in their recent (GRC) General Rate Case filing to move a larger percentage into TOU demand charges, and away from Max or Non-coincident demand charges. This is an acknowledgment that the utilities are most motivated to reduce their system-wide peak, which occurs during the “on-peak” period, currently defined as 4 pm – 9 pm on most tariffs. By levying higher “on-peak” demand charges customers are incentivized to shift their loads outside that time window. As mentioned earlier, we expect to see new experimental demand charge structures and ratchets get introduced. Examples being daily demand charge rates, or possibly a push by utilities to implement demand charges on residential customers.
Utilities are well aware of the fact that solar PV systems do not reduce demand charges as efficiently as they do energy charges. We published a blog in 2017 entitled, Demand Charge Savings from Solar PV – The Definitive Guide that overviews the different sides of this topic. Solar advocates have long accused utilities of shifting more of their cost recovery onto demand charges, as a covert way to weaken the value proposition of rooftop solar. Whether that was their intention or not, higher demand charges in exchange for lower energy charges, does reduce the bill savings that solar can capture. On the flip side, higher demand charges create an opportunity for energy storage. Peak-shaving or demand charge management is generally the primary value stream or bill savings opportunity for behind-the-meter C&I energy storage projects. Sophisticated solar and energy storage project developers are aware of these dynamics and strategically optimize their system sizes to reduce demand charges and the overall electric bill.