
It is surprisingly difficult to find clear and reliable electric utility bill cost inflation data from a trustworthy source. Most published reports do not measure cost inflation felt by homeowners and businesses, making the data less practical. For example, the widely cited U.S. Energy Information Administration (EIA) Electric Monthly Update report calculates the average retail electricity cost by state using a formula that divides total utility revenues ($), by total sales of electricity (kWh). This high-level measure does not capture the considerable variance in costs between utilities and different rate schedules. It’s not granular enough to be useful for an end-customer, such as a homeowner living in the Southern California Edison service territory.
Utilizing representative utility bill cost inflation data is critical for determining the economics of a behind-the-meter (BTM) solar + storage project. The annualized ‘utility rate inflation’ input is one of the most influential assumptions in the financial model when determining the lifetime economics of a project. Given that rate inflation compounds over time and financial models are typically run over a 25+ year period, the input will materially influence the payback period, return on investment, and net present value. The solar industry lacks standardization when it comes to this critical input. It is not uncommon for a homeowner soliciting solar proposals from several installation companies to receive widely varying assumptions on the inflation rate.
Our Whitepaper
The Energy Toolbase team conducted an in-depth study to determine utility bill cost inflation in California’s big three investor-owned utility (IOU) territories over the last decade. Our study utilized a practical methodology for quantifying cost inflation felt by actual end customers over a ten-year period, from 2014 to 2023, for a typical residential and commercial (office building) customer in the Pacific Gas & Electric (PG&E), Southern California Edison (SCE), and San Diego Gas & Electric (SDG&E) service territories.
Our whitepaper also summarizes the primary factors driving rate inflation, which helps to inform how rates may escalate over the next decade. Additionally, we discuss how utility bill cost inflation compares to avoided cost inflation. We review the impact of California’s new net metering version 3.0 (NEM-3) Net Billing Tariff, and how that affects rate inflation in a 25-year financial model.
Results
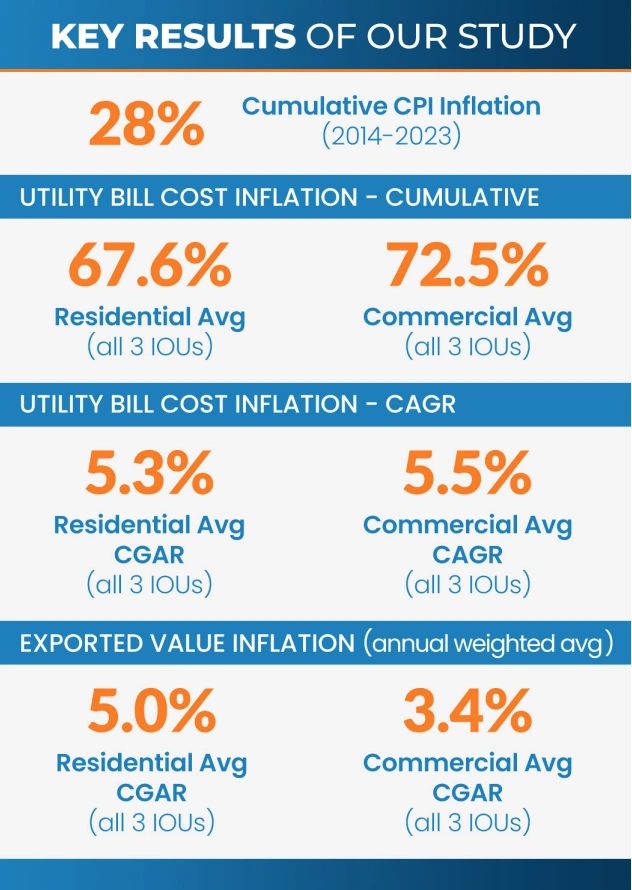
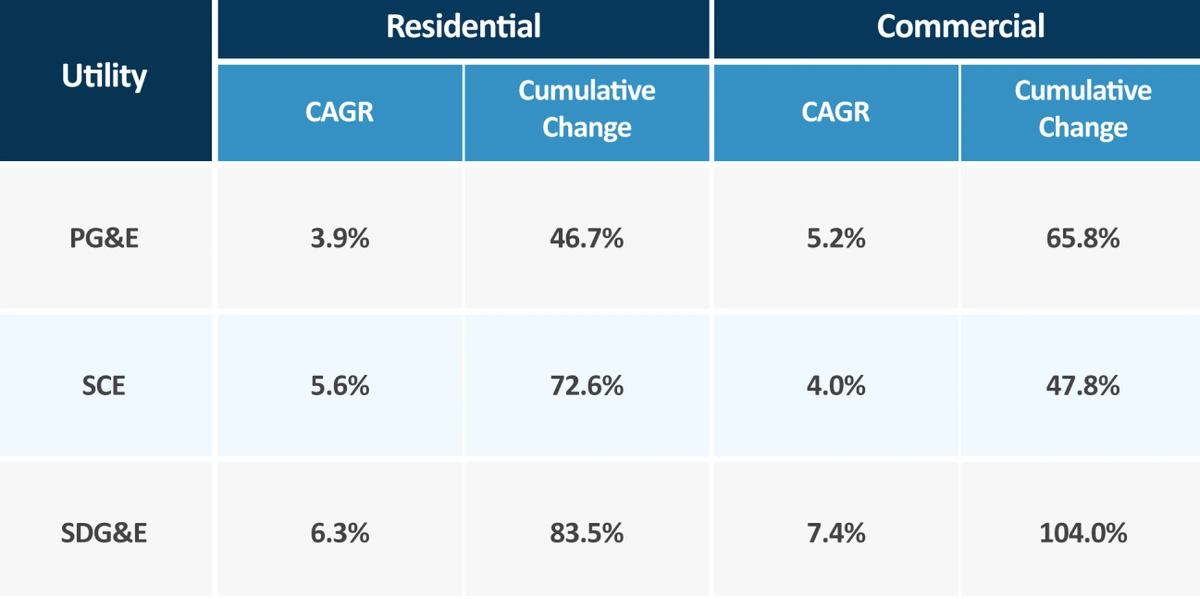
Our study determined that electric utility bills in California cumulatively inflated roughly 70% on average over our 10-year study period. This cumulative rise is roughly 2.5 times higher than the 28% cumulative inflation rate, measured by the Consumer Price Index (CPI), over the same 2014 to 2023 period. Depending on the utility and customer segment, the Compound Annual Growth Rate (CAGR) ranged between 3.9% to 7.4%, as shown in the table below.
One key observation of our study was the considerable spike in electric bill costs from 2020 to 2023, which accounted for over 75% of the total cumulative increase, when averaging the results of all utility territories and customer segments. This sharp recent increase was driven by a combination of significantly higher wholesale natural gas prices, elevated general CPI inflation, in addition to costs increases associated with wildfire mitigation and grid hardening programs.
Our whitepaper is intended as a reference for solar and storage developers, as well as homeowners and businesses.The full whitepaper, which is free to download, contains the complete table of results by each utility and customer segment.